
Report 2025
Introduction
This year’s report continues what Launch set out to do from the very beginning: to act as a guide for founders on their own unique paths. Like trail markers pointing the way, the data and stories in these pages are not prescriptions but signals helping founders, investors, and supporters see where the ecosystem is heading.
In 2025, the voices of Romanian-born founders speak of both progress and friction. More startups are reaching maturity, yet obstacles remain. At the same time, resilience, creativity, and ambition define this community.
The numbers, quotes, and perspectives collected here are more than just statistics. They are pieces of lived experience, offered by founders themselves. Taken together, they form a picture of an ecosystem that is still emergent, but undeniably moving forward.
As with every edition, this report is both a mirror and a guidepost: a mirror of the current state, and a guidepost for where Romanian startups can go next. It is an invitation to everyone in the community: founders, investors, mentors, policymakers, to keep building, supporting, and opening new paths.
The Key Insight
Founders are building leaner, more founder-led companies while relying largely on self-funding. Products skew earlier-stage, with fewer pilots and more teams pre-traction than last year. The main friction remains commercialization: revenue is more polarized, and go-to-market choices tilt B2B - SMBs a pragmatic path when funds and headcount are tight.
1) Leaner teams. Founder cash first.
- 71.6% say they’ve bootstrapped/self-funded overall; 72.3% haven’t run a recent fundraising process.
- 52.6% have 0 employees (vs 45.5% in 2024; 36.1% in 2023). Founding mix: 2–3 founders 58.6%, solo 28.6% (2024: 65.3% / 16.5%).
- ESOP adoption dipped to 24.1% (from 38.1% in 2024; 28.1% in 2023). Runway is short for many: <3 months 16.2%, 3–6 months 22.3%.
Why it matters: With more solo/compact teams and limited external capital, founders prioritize cash discipline and personal runway. This tight setup amplifies the need for repeatable sales motions and ownership incentives—yet ESOP usage dropped, making senior hiring/retention tougher when growth requires it.
2) Commercialization is the pain point. GTM tilts B2B (SMBs).
- Growth & commercialization is the #1 challenge: 37.1% (2023: 35.6%). Funding & financial pressure sits at 18.1%.
- Revenue is more polarized: €0 = 44% (vs 27.1% in 2023). Recurring remains the dominant model (47.5%; 2024: 47.1%).
- Business model rotates to B2B (SMBs 31.5%); B2C 26.5%, B2B (Enterprise) 23.5%. Skills gaps concentrate in Sales/Marketing/Comms/UX.
Why it matters: When capital and headcount are tight, founders pick shorter-cycle GTM (SMB) and push recurring revenue for predictability. The top-cited gaps—sales/marketing/UX—mirror the challenge: turning builds into business requires distribution, positioning, and proof points, not just shipping products.
Recommendation for readers
Use this report as a mirror and a map—signals, not rules. Start with the Introduction and Key findings, then jump to the chapter that matches your current challenge—Founding & Team (hiring/roles), Product & Traction (pilots/users), Funding & Revenue (runway/monetization), or Industry & Business Model (GTM choices). Read charts with care: note what each question asked, beware tiny percentage shifts, and treat quotes as context, not totals.
Cross-check these patterns with your own metrics. For guidance, use Solutions for current issues for practical steps and KPIs; explore Predictions & Theories for the future to test direction; and send input through Feedback on our Take. Find ways to connect in About Launch Romania — Near Future/Announcements. Finally, set next steps in Conclusions, and meet the Partners, Contributors, and Supporters that helped make this report possible.
Thank you everyone for supporting us and let’s dive into this year’s report!
Quotes About Our Report
This report answers a need that we, as supporters of entrepreneurship, have felt for many years—and one that founders themselves often express: the need for a common, data-driven understanding of the state of Romanian-born early-stage startups. Having this shared perspective is essential for building stronger bridges between founders, investors, and corporate partners.
The insights revealed—such as the rise of repeat founders, the crucial role of early product validation, and the diversity of industries and business models—paint a realistic picture of both the opportunities and challenges in the ecosystem. By highlighting funding gaps and structural hurdles, the report helps us, collectively, to focus our efforts where they matter most.
Ultimately, this kind of mapping is not just about observing trends; it’s about equipping the entire entrepreneurial community with the clarity needed to accelerate innovation and scale Romanian startups to their full potential.”
Cătălin Lupoaie | B2B Marketing Manager, BCR
This report is more than just a collection of insights—it is a mirror reflecting where we stand as an ecosystem today. It highlights the resilience of repeat founders, the central role of validation, and the diversity of industries and ideas emerging from Romania. At the same time, it points to the critical gaps that remain, especially in access to funding and scaling resources.
For me, the true value of this report lies in how it brings all of us—founders, investors, and ecosystem builders—onto the same page. It is both a map of our progress and a call to action for the next stage of growth, reminding us that building world-class startups requires not only talent and ambition, but also collective commitment.”
Alexandru Agatinei | CEO, How to Web
About the data
Who this reflects
- This report draws on a survey of Romanian-born founders building early-stage startups.
- Romanian-born means that, at founding-team level, all or the majority of founders have Romanian roots.
- Early-stage means companies that have raised up to a Series A and/or are below €100k monthly recurring revenue (MRR).
- Startup means a tech-oriented company built around an innovative product or service, designed from the outset with scalability in mind. Unlike traditional small businesses, startups aim for rapid growth through technology, repeatable business models, and the potential to serve large or global markets.
What’s inside
Findings are organized along the founder journey, mirroring previous editions for comparability:
- → Founding & Team
- → Product & Traction
- → Industry & Business Model
- → Funding & Revenue
Scope & limitations
This is a survey of founders’ own reporting. It’s designed to surface signals, not prescribe outcomes, and—like prior years—may not mirror every team’s reality across the ecosystem. Use it alongside your own metrics and context.
Privacy & treatment
Responses were cleaned for obvious duplicates/inconsistencies; results are presented in aggregate. No company-level data is disclosed.
Check out Side Events on Launch Day
- Garden Party — Oct 1, 18:00 (in-conference; ticket holders). How to Web
Other side events this week worth a look
- The Leap of Tech #11 — Oct 2, 15:00 (in-conference). How to Web
- Defence & Dual Use in Eastern Europe — Oct 2, 16:00 (in-conference). How to Web
- Official After Party — Oct 2, 19:00 (private location; ticket holders). How to Web
Some side events require a How to Web 2025 ticket and/or RSVP/invite—check details and book your spot on the official side-events page.
On FOUNDING & TEAM
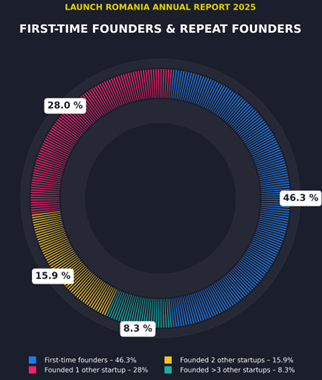
How many other startups have you previously founded / co-founded?
In 2025: 46.3% of founders are first-time founders. Among repeat founders, 28.0% previously founded one other startup, 15.9% founded two, and 8.3% founded more than three.
How this compares
First-time founders have increased across editions: 41.6% (2023) → 43.0% (2024) → 46.3% (2025). Among repeat founders, one previous startup is trending down (32.5% → 31.4% → 28.0%), while two previous startups is roughly unchanged (15.1% → 14.0% → 15.9%).
Incubators / Accelerators
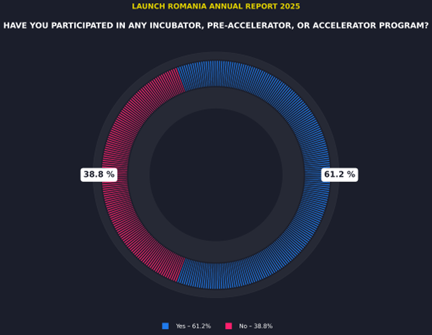
Have you participated in any incubator, pre-accelerator, or accelerator program?
In 2025, 61.2% of founders say they’ve participated in an incubator, pre-accelerator, or accelerator, while 38.8% have not.
What this shows
- Programs are mainstream in the Romanian-born early-stage path (most teams have tried at least one).
- A sizeable minority don’t use programs, which means direct-to-market learning and community routes are also viable.
- Here, “participation” just means a team attended at least one program; it doesn’t tell us how long it lasted, how intensive it was, or what outcomes it produced.
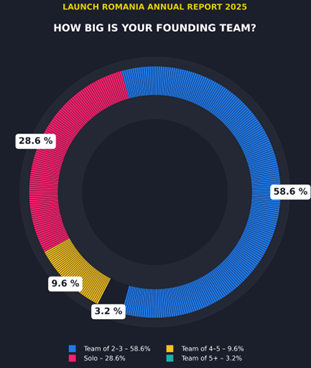
How big is your founding team?
In 2025, most teams are 2–3 founders (58.6%), followed by solo founders (28.6%), then 4–5 (9.6%) and 5+ (3.2%).
What changed vs 2024
- Solo: 16.5% → 28.6% (+12.1 pp)
- 2–3 founders: 65.3% → 58.6% (–6.7 pp)
- 4–5 founders: 14.0% → 9.6% (–4.4 pp)
- >5 founders: 4.1% → 3.2% (–0.9 pp)
Two-year view (2023 → 2025)
- 2–3 founders stayed the core: 60.2% → 58.6%
- Solo grew: 18.1% → 28.6% (+10.5 pp)
- 4–5 founders eased: 17.5% → 9.6% (–7.9 pp)
- >5 founders nudged down: 4.2% → 3.2% (–1.0 pp)
Do you have a woman co-founder in your team?
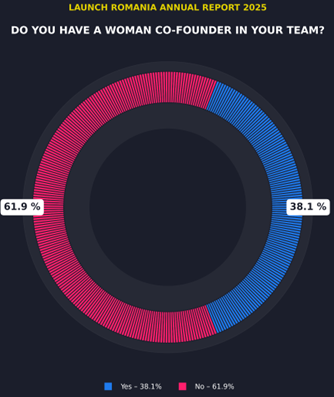
In 2025, 38.1% of teams report having a woman co-founder, while 61.9% do not.
What this shows
- Nearly 2 in 5 founding teams include a woman co-founder — a clear presence, with room to grow.
Community note: We’re also hosting EmpoWomen Demo Day this year—a side event spotlighting 14 female-led deep-tech startups, with rapid-fire pitches, live jury selections, and focused networking with investors, operators, and founders. Check here for details and ways to join.
How many employees do you have?
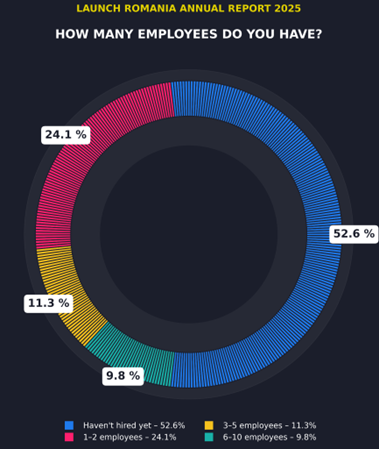
In 2025: 52.6% of startups haven’t hired yet. Among those with employees, 24.1% have 1–2, 11.3% have 3–5, and 9.8% have 6–10.
How this compares
- 2024 → 2025 — 0 employees rose 45.5% → 52.6% (+7.1 pp); 1–2 increased 20.7% → 24.1% (+3.4 pp); 3–5 inched up 9.9% → 11.3% (+1.4 pp); 6–10 eased 10.7% → 9.8% (–0.9 pp).
- 2023 → 2024 → 2025 — 0 employees 36.1% → 45.5% → 52.6%; 1–2 25.9% → 20.7% → 24.1%; 3–5 15.1% → 9.9% → 11.3%; 6–10 11.4% → 10.7% → 9.8%.
If you have employees, have you implemented ESOP (Employee Stock Ownership Plan)?
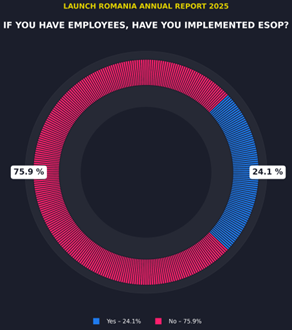
In 2025, 24.1% report having an ESOP, while 75.9% do not. (What is an ESOP?)
How this compares
- 2024: Adopted 38.1% · No 61.9%
- 2023: Adopted 28.1% · No 71.9%
What this shows
After a step-up in 2024, ESOP adoption pulled back in 2025 (–14.0 pp vs. 2024) and sits closer to 2023 levels (–4.0 pp vs. 2023). That means most teams with employees are still operating without a formal equity plan.
Your role within the founding team is …
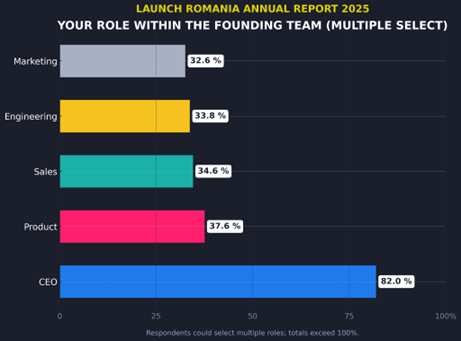
Most survey responses come from CEOs (82.0%). Founders also report wearing multiple functional hats: Product (37.6%), Sales (34.6%), Engineering (33.8%), and Marketing (32.6%). These shares reflect multi-role founders and won’t sum to 100%.
- CEO: 82.0% of respondents
- Product: 37.6%
- Sales: 34.6%
- Engineering: 33.8%
- Marketing: 32.6%
Note: multiple hats per founder; categories won’t total 100%.
How to read it
The findings in this report are viewed mainly through a CEO perspective, with strong product and commercial involvement across respondents. This “many hats” pattern is consistent with prior editions, where founders frequently reported mixed roles.
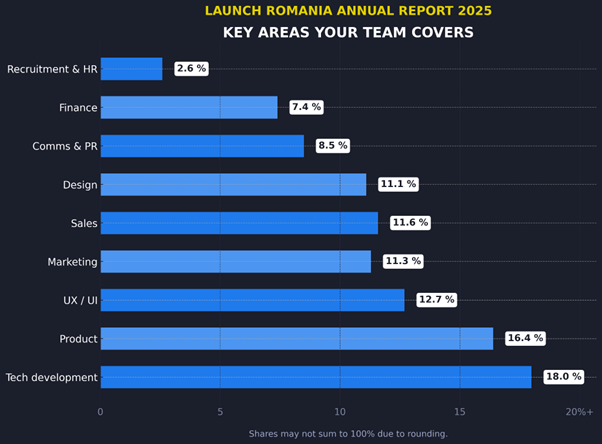
What are the KEY AREAS YOUR TEAM DOES COVER?
Founders say their teams most often cover Tech development (18.0%) and Product (16.4%), followed by UX/UI (12.7%), Sales (11.6%), Marketing (11.3%), Design (11.1%), Comms & PR (8.5%), Finance (7.4%), and Recruitment & HR (2.6%).
How this compares
- 2024: coverage was more top-heavy, led by Marketing (50%), then Product (20%), Engineering (20%), Sales (10%).
- 2023: most teams reported “a mix of all” (94%), with small mentions of Tech development (4.2%), Product (0.6%), Finance (0.6%), Comms & PR (0.6%).
What this shows
2025 coverage leans toward build functions (tech + product + UX/UI), while commercial and outbound areas (sales, marketing, comms) are present but thinner, and Recruitment/HR (2.6%) is rarely an in-house focus at this stage.
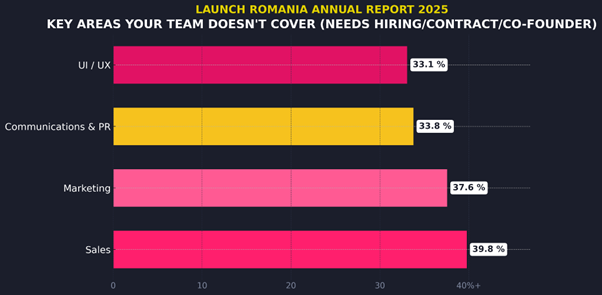
What are the KEY AREAS YOUR TEAM DOESN'T COVER, BUT YOU NEED to hire / contract / find co-founder for?
Founders most often say this year that they need: Sales (39.8%), Marketing (37.6%), Communications & PR (33.8%), and UI/UX (33.1%). (Multi-select question.)
How this compares
- 2024: Sales 25%, Recruitment 25%, Finance 15%, Tech 10%, Comms/PR 10%, Marketing 10%, Design 5%.
- 2023: “A mix of all” 84.6%; small shares for specific gaps (e.g., Sales 4.1%, Tech 3.6%, Finance 1.8%, Comms & PR 1.8%, Marketing 1.2%, Recruitment & HR 1.2%, etc.).
On PRODUCT & TRACTION
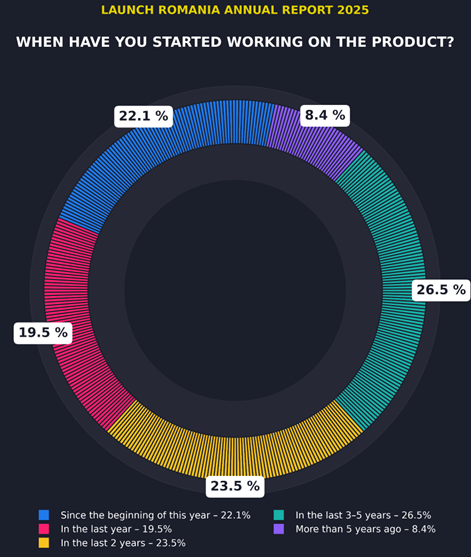
When have you started working on the product?
In 2025, teams are spread across time horizons: 23.4% started since the beginning of this year, 19.7% in the last year, 23.4% in the last 2 years, 25.5% in the last 3–5 years, and 8.0% more than 5 years ago.
How this compares
- 2024: Last 2 years 36.4%, 3–5 years 28.9%, Last year 22.3%, >5 years 11.6%.
- 2023: Last year 23.5%, Last 2 years 38.6%, 3–5 years 31.3%, >5 years 4.8%, This year 1.8%.
- 2022: Between 1–2 years 58.1%, More than 2 years 30.6%, This year 11.3% (different grouping).
What this shows
Compared to 2024–2023, 2025 looks more evenly distributed across recent windows, with a notable share starting this year (23.4%) and 3–5 years ago (25.5%). The 2024 concentration in “last 2 years” (36.4%) has eased, suggesting a mix of new builds entering the pipeline and longer-build products still in play.
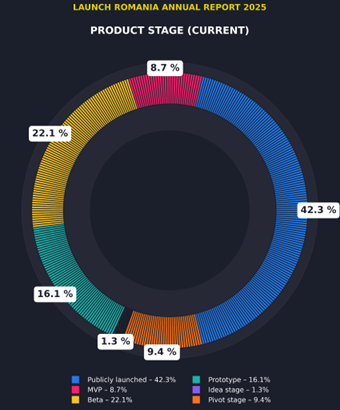
In terms of product stage, your product is currently…
This year products sit across all stages, with a tilt toward build/iterate rather than fully out: Publicly launched 42.3%, Beta 22.1%, Prototype 16.1%, MVP 8.7%, Pivot 9.4%, Idea 1.3%.
What changed
- Fewer products are publicly launched: 48.8% → 42.3%.
- Beta jumped: 10.7% → 22.1%.
- Prototype increased: 11.6% → 16.1%.
- MVP is smaller: 14.0% → 8.7% (many teams moved to Beta or stepped back to tighten build).
- Pivot at 9.4% (near 2023’s 8.4%): course-corrections remain normal.
- Idea is tiny at 1.3% — most are already hands-on with something users can try.
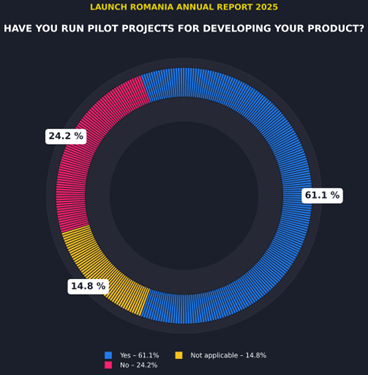
Have you run pilot projects for developing your product?
2025: Yes 63.5%, No 21.9%, N/A 14.6%.
How this compares
- 2024: Yes 70.8%, No 19.2%, N/A 10.0%.
- 2023: Yes 70.9%, No 23.0%, N/A 6.1%.
What this shows
- Fewer teams are running pilots than in 2023–2024, and more say pilots aren’t applicable right now.
- Read alongside Product stage (larger Beta/Prototype shares): many teams are still building/validating and haven’t set formal pilot flows.
- For launched products, this may signal a shift to direct trials or paid onboarding instead of classic design-partner pilots.
- In Beta/Prototype, make pilots count: define success criteria up front and include a priced rollout path if targets are met.
- Track core metrics: activation, usage depth, conversion to paid.
- If already launched, decide where pilots still help (complex integrations, enterprise) vs. where a simplified trial → paid funnel is faster.
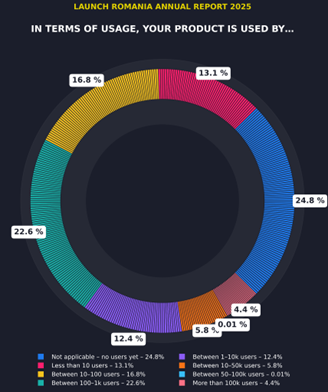
In terms of usage, your product is used by…
Usage is spread across the spectrum: no users yet 24.8%, <10 users 13.1%, 10–100 users 16.8%, 100–1k users 22.6%, 1–10k users 12.4%, 10–50k users 5.8%, 50–100k users 0.01% (less than 1%), >100k users 4.4%.
How this compares
- 2024: 100–1k 24%, 1–10 22%, 10–50 20%, 50–100 13%, >1k 12%, 0 users 9%.
- 2023: 1–10k 23.5%, 100–1k 21.7%, <10 18.1%, 10–100 13.9%, no users 11.4%, >100k 4.8%, 50–100k 3.6%, 10–50k 3.0%.
What this shows
- More teams have no users yet than last year (24.8% vs 9% in 2024), aligning with the larger Beta/Prototype pool.
- Early traction band (100–1k users) remains significant at 22.6% (2024: 24%; 2023: 21.7%).
- At scale, >1k users totals 22.6% in 2025 (1–10k 12.4% + 10–50k 5.8% + 50–100k 0.01% + >100k 4.4%), versus 12% in 2024 (single bucket) and a higher combined share in 2023.
- No users yet: pick one customer type, talk to 5–10, and offer a tiny trial they can finish in one sitting.
- 10–100 users: make starting simple—one clear path in, one clear first action; remove the biggest blocker this month.
- 100–1k users: check who returns after a week/month, fix the biggest drop-off step, try one small pricing change.
- >1k users: write a one-page “getting started”, cut extra steps in onboarding, and answer repeat questions with a short help page.
On INDUSTRY & BUSINESS MODEL
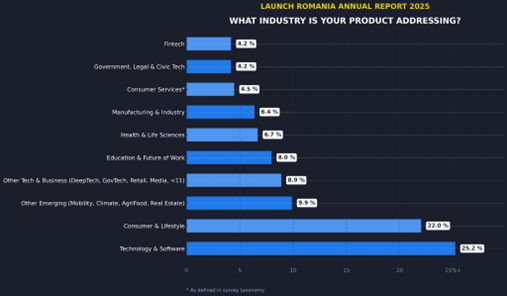
What industry is your product addressing?
The leading focus areas are Technology & Software (25.2%) and Consumer & Lifestyle (22.0%). They’re followed by Other Emerging (Mobility, Climate, AgriFood, Real Estate) 9.9%, Other Tech & Business (DeepTech, GovTech, Retail, Media, <11) 8.9%, Education & Future of Work 8.0%, Health & Life Sciences 6.7%, Manufacturing & Industry 6.4%, Consumer Services 4.5%, Fintech 4.2%, and Government, Legal & Civic Tech 4.2%.
How this compares
- 2024: more even spread with a visible “A Mix / Other” 20.6%; top named categories: Education 14.3%, Health 12.7%, E-commerce 9.5%, Productivity Tools 9.5%, Customer services 7.9%, Dev Tools 6.3%, Entertainment 4.8%, Transportation 4.8%, Energy 3.2%, Finance 3.2%, HR 3.2%.
- 2023: dominated by “A mix / Other” 68.2%, with smaller shares for Education 5.7%, Health 7.4%, Finance 4.0%, Customer Service 3.4%, Productivity tools 3.4%, and others.
- 2022: sizable “A Mix / Other” 25.9%, alongside Dev Tools & Productivity 14.5%, Health 11.3%, Education 9.7%, HR & Freelancing 8.1%, Automotive & Mobility 6.5%, and smaller niches.
What this shows
Compared with prior years—where “Mix/Other” was large—2025 is more clearly concentrated around software and consumer themes, while emerging domains (mobility, climate, agrifood, real estate) and deep/industry tech each hold a meaningful slice. This mix suggests room for near-term software plays and longer-cycle builds in heavier industries.
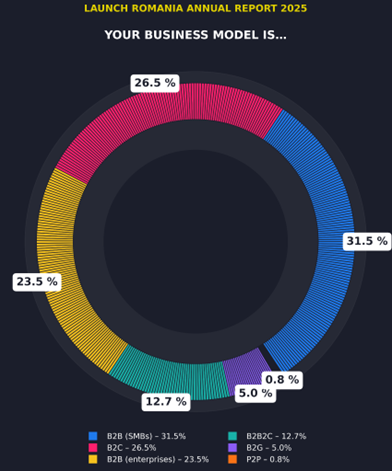
Your business model is…
The leading model is B2B (SMBs) 31.5%, followed by B2C 26.5%, B2B (enterprises) 23.5%, B2B2C 12.7%, B2G 5.0%, and P2P 0.8%.
How this compares
- 2024: B2B2C 29.0%, B2B (SMBs) 25.8%, B2C 22.6%, B2B (enterprise) 21.0%, B2B & B2C (not B2B2C) 1.6%.
- 2023: A mix 47.6%, B2B (enterprises) 9.0%, B2C 16.9%, B2B2C 12.7%, B2B (SMBs) 13.9%.
- 2022: B2B 37.8% (no SMB/enterprise split), B2C 25.6%, B2B2C 20.0%, Marketplace 14.4%, B2G 2.2%.
What this shows
- Center of gravity moved back to B2B, especially SMBs (now the largest single model).
- B2B2C dropped sharply (29.0% → 12.7%), while both B2C and enterprise B2B gained ground.
- B2G remains a small but present slice.
- In short: more teams are choosing simpler, faster sales cycles over multi-sided or hybrid routes.
On FUNDING & REVENUE
What is the current profitability status of your product?
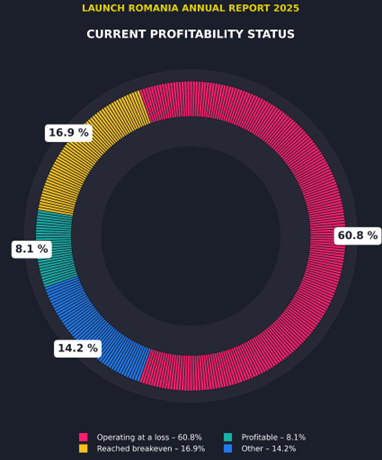
2025: 60.8% of teams report operating at a loss, 16.9% have reached breakeven, 8.1% are profitable, and 14.2% selected other.
- Operating at a loss — 60.8%
- Breakeven — 16.9%
- Profitable — 8.1%
- Other — 14.2%
How much runway do you currently have?
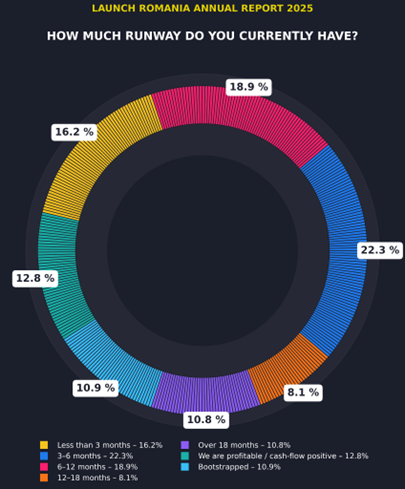
Runway splits as follows: Less than 3 months 16.2%, 3–6 months 22.3%, 6–12 months 18.9%, 12–18 months 8.1%, Over 18 months 10.8%, We are profitable / cash-flow positive 12.8%, Bootstrapped 10.9%.
What this shows
- About 38.5% have under 6 months of runway (16.2% + 22.3%).
- 18.9% sit in 6–12 months, and another 18.9% report 12+ months (12–18 months 8.1% + over 18 months 10.8%).
- A further 12.8% are cash-flow positive, and 10.9% marked bootstrapped.
- Many teams are bootstrapped, earlier in product stage, and still building pilots/traction; short cash horizons are expected, so spend is paced carefully.
- <6 months: narrow the ICP, focus on a few deals you can close now; prioritize pilots with priced rollout paths.
- 6–12 months: set clear, time-bound milestones tied to pilots, active users, and first revenue.
- 12+ months / cash-flow positive: invest in repeatable channels and the first hires that remove bottlenecks.
You've raised investment from…
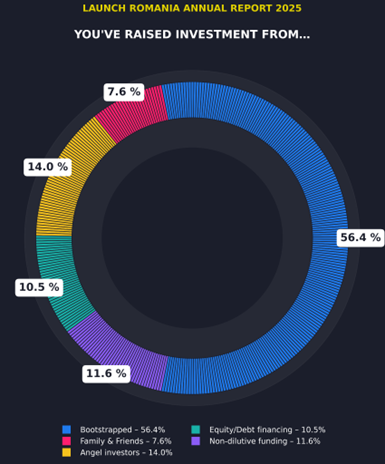
Teams report raising from: Bootstrapped 56.4%, Angel investors 14.0%, Non-dilutive funding 11.6%, Equity/Debt financing 10.5%, Family & Friends 7.6%.
How this compares
- 2024: Family & Friends 50%, Angel investors 33.3%, VC 16.7%, Accelerators 10%, Others 5%.
- 2023: Not applicable 45.5%, A mix 34.1%, Business angels 9.6%, VC 6%.
- 2022: Family & Friends 50%, Angel investors 20%, VC 15%, Accelerators 10%, Others 5%.
What this shows
This year skews self-funded: bootstrapping is the most common path, while angel and institutional money show smaller shares than in 2024. The presence of non-dilutive and equity/debt options suggests founders are mixing sources to extend runway without over-dilution.
Looking back, how much funding have you raised so far?
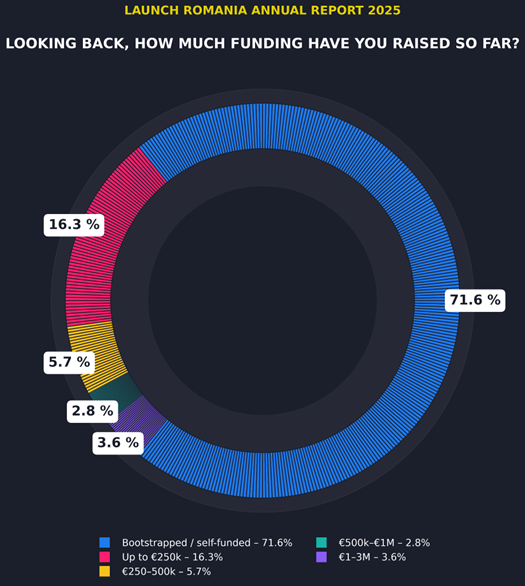
Most teams say they haven’t raised: bootstrapped/self-funded 71.6%. Among those who did raise, the most common bracket is up to €250k 16.3%, followed by €250–500k 5.7%, €500k–€1M 2.8%, and €1–3M 3.6%.
How this compares
- 2024: No fundraising 62.8%, up to €250k 18.2%, €250–500k 7.4%, €500k–€1M 2.5%, €1–3M 7.4% (plus small shares in €3–5M, €5–10M, >€10M).
- 2023: No fundraising 61%, up to €250k 12%, €250–500k 10.2%, €500k–€1M 10.8%, €1–3M 5.4%, €5–10M 0.6%.
- 2022: different brackets, but small tickets dominated (combined <€200k buckets were the majority).
What this shows
More teams are self-funding than in the last two years, and the share of larger rounds is smaller than in 2024.
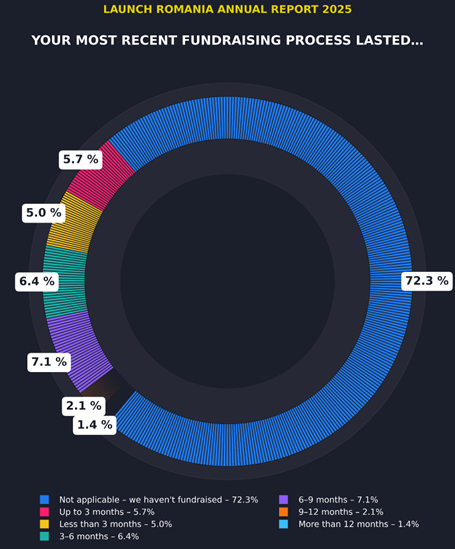
Your most recent fundraising process lasted…
Most teams did not run a fundraising process: not applicable 72.3%. Among those who did, timelines vary: up to 3 months 5.7%, less than 3 months 5.0%, 3–6 months 6.4%, 6–9 months 7.1%, 9–12 months 2.1%, more than 12 months 1.4%.
How this compares
- 2024 (among teams that did fundraise): 3–6 months 26.7%, 6–9 months 26.7%, <3 months 15.6%, 9–12 months 15.6%, >12 months 15.4%.
- 2023: Not applicable 51.2%, then 3 months 15.1%, 3–6 months 13.9%, 6–9 months 7.2%, 9–12 months 6.0%, 12 months 6.6%.
What this shows
Far more teams skipped fundraising in 2025 than in 2023, and when founders did raise this year, most timelines cluster around 3–9 months, with a smaller slice finishing under 3 months (5.7% + 5.0%). Read together with earlier sections (more bootstrapping, leaner teams, earlier product stages), it fits a year where many founders chose to build and sell first and only a minority ran a full fundraising process.
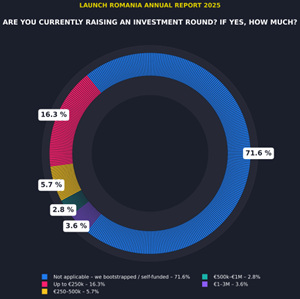
Are you currently raising an investment round? If yes, how much are you targeting?
In 2025, most founders aren’t fundraising: 71.6% say “not applicable — we bootstrapped / self-funded.” Among those raising, activity clusters at the low end: 16.3% up to €250k, 5.7% at €250–500k, and 2.8% at €500k–€1M. Only a small slice targets growth-stage sums, with 3.6% aiming for €1–3M. The signal is clear: lean teams, shorter runways, and tightly scoped rounds dominate the landscape.
What this means in 2025 (useful read)
- Many teams are lean and early (more Beta/Prototype, more pre-revenue), so fresh raises often look like sub-€500k or €500k–€1M to cover a few key hires and a clear 6–12 month plan.
- €1–3M+ targets typically imply you already have steady usage and a repeatable go-to-market — you want to scale, not just experiment.
- Match the band to one concrete milestone (e.g., “reach public launch,” “sustain weekly active use,” or “standardize one sales channel”) and spell out use of funds in one line per hire/action.
- Keep the process focused: one target range, one story, one short list of investors who fit your stage and model (e.g., SMB B2B vs. enterprise).
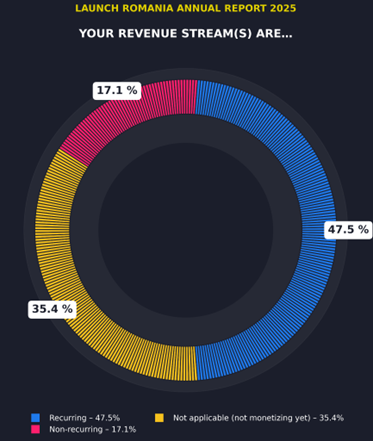
Your revenue stream(s) are…
Teams report Recurring 47.5%, Non-recurring 17.1%, and Not applicable (not monetizing yet) 35.4%.
How this compares
- 2024: Recurring 47.1%, Non-recurring 19.2%, Not monetizing 33.7%.
- 2023: Recurring 18%, Non-recurring 17%, Not monetizing 16% (plus “a mix of all” 33%).
What this shows
Recurring remains the dominant model and is essentially flat vs 2024 (47.1% → 47.5%). The share not monetizing yet is a bit higher than last year (35.4% vs 33.7%), consistent with other 2025 signals (larger Beta/Prototype pool and more teams pre-revenue). Non-recurring eased to 17.1% (from 19.2%).
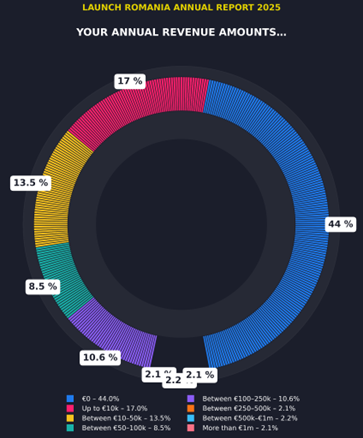
Your annual revenue amounts…
Most teams sit at the earliest revenue levels: €0 — 44%, up to €10k — 17%, €10–50k — 13.5%. A smaller group is in the middle — €50–100k (8.5%) and €100–250k (10.6%); only a few report larger revenues: €250–500k (2.1%), €500k–€1m (2.2%), >€1m (2.1%).
How this compares to 2023
- Pre-revenue higher: 44% vs 27.1% (+16.9 pp).
- Entry bands smaller: up to €10k 17% vs 22.9%; €10–50k 13.5% vs 21.1%.
- Mid-range similar/slightly up: €50–100k 8.5% vs 8.4%; €100–250k 10.6% vs 9.0%.
- Upper bands thinner: €250–500k 2.1% vs 4.2%; €500k–€1m 2.2% vs 4.2%; >€1m 2.1% vs 3.0%.
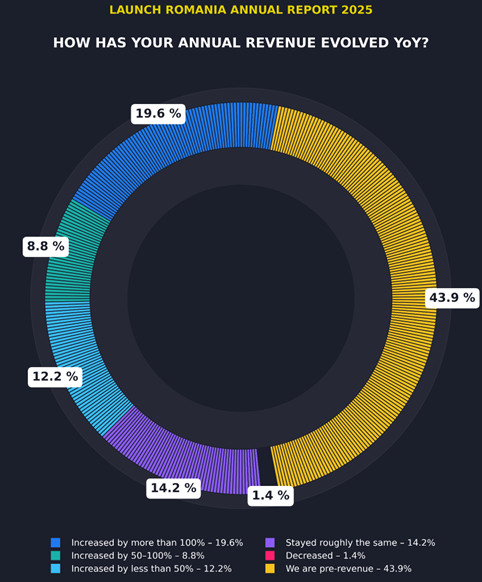
How has your annual revenue evolved Year-over-Year (YoY)?
Founders report: pre-revenue 43.9%, increased by >100% 19.6%, increased by 50–100% 8.8%, increased by <50% 12.2%, stayed roughly the same 14.2%, decreased 1.4%.
- Pre-revenue: 43.9%
- >100% increase: 19.6%
- 50–100% increase: 8.8%
- <50% increase: 12.2%
- Roughly the same: 14.2%
- Decreased: 1.4%
On OTHER
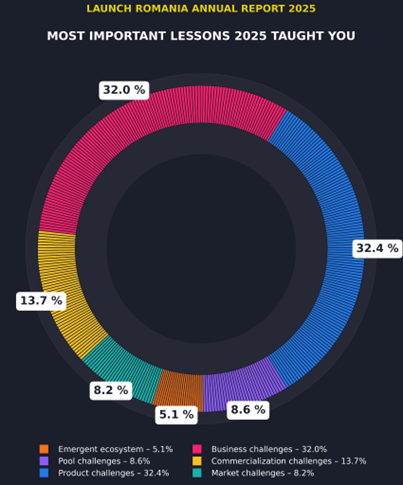
What are the most important lessons 2025 taught you?
- Product — 32.4%
- Business — 32.0%
- Commercialization — 13.7%
- Pool (people/partners) — 8.6%
- Market — 8.2%
- Emergent ecosystem — 5.1%
How this compares (2023)
- Business development & growth — 57.8%
- Mindset & work ethic — 11.7%
- Uncertainty & survival — 10.2%
- Product launch — 7.8%
- Investment — 3.9%
- Team development — 3.1%
- Knowledge & networking — 2.3%
- Pivot — 1.6%
- Impact — 0.8%
- Exit — 0.8%
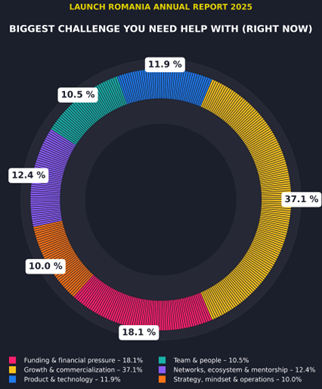
What's the biggest challenge that you need help with at the moment?
Founders most often cite Growth & commercialization (37.1%), then Funding & financial pressure (18.1%), Networks, ecosystem & mentorship (12.4%), Product & technology (11.9%), Team & people (10.5%), and Strategy, mindset & operations (10.0%).
Compared to 2023
- Growth & commercialization: 35.6% → 37.1% — still the top friction (in 2023 led by Sales 19.8% and Marketing 5.0%).
- Funding & financial pressure: 24.8% → 18.1% — lower than 2023’s mix (Investment 22.3%, Profitability 0.8%, Survival 1.7%).
- Networks / ecosystem / mentorship: 4.0% → 12.4% — clear rise in demand for warm intros & guidance.
- Product & technology: 8.9% → 11.9% — up, consistent with more teams iterating pre-launch.
- Team & people: 15.7% → 10.5% — down from 2023 (recruiting 5.8%, team formation 5.0%, co-founder 4.1%).
- Strategy / mindset / operations: 10.0% → 10.0% — broadly unchanged.
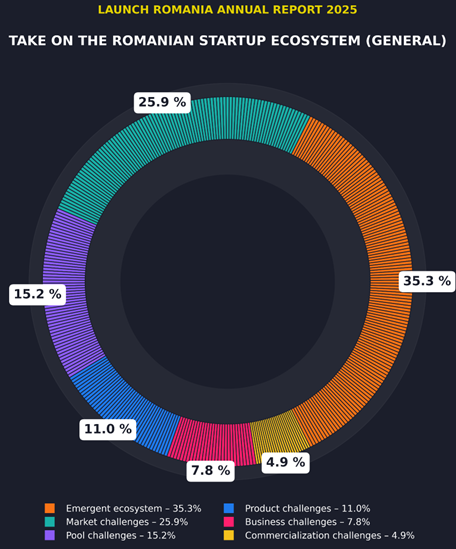
What's your take on the Romanian startup ecosystem in general?
Founders describe Romania’s startup landscape as an emergent ecosystem (35.3%). The main frictions they point to are market challenges (25.9%) and pool challenges — access to talent/partners/capital (15.2%). Company-level issues appear less often: product (11.0%), business (7.8%), commercialization (4.9%).
What this means
- Founders mostly frame Romania as emergent with market constraints (size, fragmentation, purchasing power, procurement/regulation).
- Pool gaps: specialist talent, senior operators, warm intros, funding routes.
- Product/Business appear less as ecosystem problems → teams feel they can build & operate, but access to customers/resources is slower than they’d like.
How this contrasts with 2023
In 2023, when asked about their biggest challenge, founders put Growth & commercialization (35.6%) and Funding & financial pressure (24.8%) at the top, with Team & people (15.7%) next — i.e., company-level hurdles around selling and raising dominated. In 2025, when asked for an ecosystem take, founders shift emphasis to structural context
Founder Signals by Launch
Here, we let founders speak. Short, real notes—what they’re building, where it hurts, what moved the needle. These voices echo the patterns in the data: make the right thing, run it well, and turn it into customers—while navigating an emergent market and a still-forming support pool. The quotes aren’t rules or totals; they’re snapshots that add texture to the charts. Read them as prompts: what resonates with your path, what challenges your assumptions, and what single step you’ll try next.
1. AI power concentration & user exclusion
“For the past 3 years, in our agency but in our own products as well we saw that all the money for AI goes to big corporations I yet we have so much idle power sitting at home, in servers. We wanted an alternative to the scary outcome that AGI present and the fact that all big tech are going in that direction Leaving common folks out of the equation.”
This is a call for decentralized, user-owned AI—open models, federated/edge compute, and community-first incentives— so value doesn’t pool only with platforms. It points to an opportunity for Romanian founders to ship systems that share control and upside with users, not just providers.
2. Humans first; tech as a means, not the end
“becoming increasingly scarce yet vital in our hyper-digital world. With 30 years of experience in IT, I've witnessed the ‘flattening of human experience’ as everything is reduced to data points. This drove me to create a solution that fights against this ‘forgetting’ and brings soul back to the digital interaction with luxury.
Specifically, I was compelled by:
- The ethical imperative to combat counterfeiting, which isn't just a business problem but a public health and safety concern.
- The desire to democratize access to knowledge and value, ensuring that beauty and authentic information are not gatekept by wealth or corporate interests. This means empowering consumers and fairly compensating creators.
- The vision of preserving invaluable digital heritage (like historical databases and online communities) and leveraging cutting-edge technologies (Blockchain, AI, and ultimately, sensory tech like Qscent) to make that knowledge immutable and universally accessible.
The conviction that technology must serve humanity's well-being, and Luxora is my way of architecting a future where trust is restored, transparency is radical, and genuine human experience is immortalized.”
Today’s digital world flattens human experience into data points. Their mission is to restore trust and authenticity: fight counterfeiting, democratize access to knowledge and value beyond corporate gates, and preserve digital heritage so it stays verifiable and accessible. They’ll use tools like blockchain and AI only to serve these goals—not to replace human judgment.
This is a blueprint for human-centered tech: design for authenticity, provenance, and transparency; give users control over assets and information; and treat advanced tech as infrastructure for human outcomes (trust, equity, memory), not as the product itself.
3. Scale-up friction & “leave to grow” tension
“Overall Romanian mindset, but that's nothing we can actually do about... Funding for tech scaling up and scale up internationalization are the biggest challenges so far considering the overall geopolitical and micro and macro economical contexts.”
This founder points to the scale gap—moving from early traction to international proof. Practical response: build cross-border early (customers, advisors, partners), assemble a hybrid network (Romania + target markets), and treat local limits as a reason to export wins, not stall.
4. AI anxiety & uncertainty
“Understanding what the f*ck it up with Ai. Everybody talks about it as if it's the end of the world. I don't know what to do with that info and how to prevent that from happening to our company.”
Treat AI as a focus area, not background panic. Do three simple things:
- Map exposure: where AI could help/hurt your product, costs, or data.
- Run one 2–4 week test in a core workflow with clear guardrails and a single success metric.
- Write a one-page AI policy (what’s allowed, what’s not, who approves).
Keep it customer-anchored, then repeat what works.
5. Speed Talks
“Build faster, sell faster, go to market faster”
Light it up, ship sooner, show customers earlier, close faster. Keep the feedback loop buzzing so progress feels electric.
More than Data!
We’re not stopping at charts. Follow Launch Romania for the founder voices behind the numbers and what comes next. We’re planning a few things (can’t spill all of it yet), but expect more than data: sharper takes from open-ended answers, deeper dives on the tough bits, and practical next steps you can actually use. Stay tuned.
- Facebook: click here ←
- Instagram: click here ←
- Youtube: click here ←
- LinkedIn: click here ←
Partners’ Insights
We handed the mic—and the datasets—to our contributors and analytics partners. They reviewed four years (2022–2025) of Launch data side by side to surface patterns, shifts, and outliers we might miss from inside the report.
What you’ll find: independent takes, backed by the same numbers, focused on what changed, why it might have changed, and what to watch next. Where useful, partners zoom into segments (stage, model, industry) to keep comparisons fair. Below is their read—independent, data-first, and meant to complement our chapters.
1) Revenue reality check
- Revenue-generating 54.7% vs. pre-revenue 45.3%.
- Within earners: ≤€10k 14.8%, €10–50k 12.5%, €50–100k 9.4%, >€100k 17.2%.
Partner take: pragmatic, market-tested builder mindset rather than “plan first, sell later.”
2) Programs move the needle
- Profitability: accelerator teams 30.1% vs. non-participants 11.1%.
- External funding: 38.6% vs. 8.9%.
- Hiring: 57.8% vs. 37.8%.
Read: beyond networking—structured programs correlate with measurable business results.
3) Experience paradox
- Profitability by background: two prior startups 45.5%, first-time 23.4%, one prior 11.9%.
Interpretation: second-timers benefit most from pattern recognition; first-timers can close gaps via ecosystem support; one-time repeaters may overgeneralize past lessons.
4) Teaming wins
- >€100k revenue: teams (2–3) 25.0% vs. solo 6.5%.
- Profitability: 27.5% vs. 22.6%.
- External funding: 32.5% vs. 16.1%.
Frame: complementary skills are a decisive edge in a resource-tight market.
5) Geography: no longer a handicap
- Bucharest hosts 54.7% of startups, but regions match/exceed performance.
- >€100k revenue: regions 19.0% vs. Bucharest 15.7%.
Driver: digital distribution + regional programs flatten location advantages.
6) Gender gap (cost of lost potential)
- Teams with a woman co-founder: 35.9%.
- Large-revenue incidence: male-only 22.0% vs. mixed-gender 8.7%.
Conclusion: results reflect systemic barriers, not capability—closing access gaps is a growth lever.
7) Bootstrapping culture: strength and ceiling
- Funding model: bootstrapped 71.9% vs. externally funded 28.1%.
Trade-off: discipline and profit focus vs. slower scale in competitive international markets. Hybrid mindset: stay frugal, switch to outside capital when the growth math is clear.
8) Headcount ↔ performance
- Odds of >€100k revenue by headcount: 0 = 3.2%, 1–2 = 12.1%, 3–5 = 35.3%, 6–10 = 69.2%.
Read: capacity is the engine—when justified by demand, investing in people unlocks the next band.
9) Runway risk
- ≤6 months runway: 37.5%; stable (≥12 months or profitable): 32.0%.
Partner call: systemic fragility—short horizons can force premature shutdowns or sub-optimal decisions, especially in a bootstrapped culture.
10) Model & sectors
- Models lean: B2B (pure) 46.1% vs. B2C 10.9%.
- Sector mentions cluster: Education (25), E-commerce (18), Health (16).
Conclusions
What we saw
This year’s picture is consistent and clear: founders are running lean and funding themselves first, with 71.6% bootstrapped and over half yet to hire, while ESOP adoption pulled back—strong on discipline, thinner on equity tools. Commercialization remains the hardest nut to crack, so GTM choices tilt toward simpler, faster B2B (SMBs) motions and recurring revenue, even as revenue polarizes and more teams sit pre-traction while they build in Beta/Prototype. These aren’t red flags; they’re stage indicators. They tell us where energy is going and where support must show up.
What it means
Romania’s founder base is both resilient and pragmatic. The center of gravity is earlier (more Beta/Prototype, more teams with no users yet) and more hands-on (CEO-as-multi-hat is the norm). In a year with shorter runways and fewer formal raises, the ecosystem’s growth lever is focus: one ICP, one repeatable channel, one crisp way to turn pilot → paid. Where teams add capacity (the first commercial hires, simple ESOPs, advisor networks), outcomes accelerate; where we delay those moves, we cap momentum. The signal is the same across sections: ship sooner, show customers earlier, close faster—then compound.
Launch: mirror & guidepost
Launch remains what it set out to be from the beginning: a mirror and a guidepost signal. We’ll keep publishing the patterns that matter, but we’ll also move closer to the work: sharper takes from open-ended answers, targeted playbooks on sales/marketing/UX, and founder-led sessions where wins and misses are turned into reusable steps. This is more than charts; it’s a practical loop: build → show → learn → sell → repeat.
Feedback On Our Take — Introduction
This section hands the mic back to you. Our report is meant to be a mirror—so we want your sharpest corrections, challenges, and adds. Tell us where our read is solid, where it breaks for your reality, and what we’ve missed.
What we’re asking for
- Where our interpretation is solid — what matches your on-the-ground reality.
- Where it breaks — contexts or segments where our read doesn’t hold.
- What we’ve missed — signals, nuances, or counterexamples worth adding.
- If our emphasis on lean, mostly bootstrapped teams and commercialization friction resonates — or doesn’t — call it out and point us to better evidence (metrics, cohorts, cases).